
Relative Strength Index (RSI): Everything You Need To Know
The Relative Strength Indicator, commonly known as ‘RSI’, is a popular tool in technical analysis that helps to asses whether a security is overbought or oversold. It measures the speed and magnitude of recent security price movements and displays the result.

The Relative Strength Indicator, commonly known as ‘RSI’, is a popular tool in technical analysis that helps to asses whether a security is overbought or oversold. It measures the speed and magnitude of recent security price movements and displays the result.
In this article, we will explore the significance, history, calculation, and types of RSI. We will also discuss how to use RSI for trendline analysis, as a convergence indicator, or with other indicators.
What Is RSI?
Let’s first answer the burning question, what is RSI?
The RSI, or the Relative Strength Indicator, was introduced by J. Welles Wilder Jr. in 1978. It has since then become a widely used technical analysis tool to evaluate the strength and momentum of a security's price movements. It can be considered a momentum-based technical analysis tool that detects overbought and oversold conditions in security prices. It compares the magnitude of recent price changes over a 14-day period and presents it as a value between 0 and 100.
When you say that an asset is overbought, it means that its price has risen too much and too fast. This means there may be a higher likelihood of a price correction or pullback soon.
When a stock or other asset is said to be oversold, it means that the selling pressure that caused the price to fall may start to weaken, and the buying pressure may increase, leading to a potential price increase.
Understanding The Working Of Relative Strength Index (RSI)
Traders use the RSI to detect overbought or oversold conditions in a security's price, making better buy/sell decisions. An RSI reading above 70 suggests a correction, prompting selling. While an RSI below 30 means the security may be undervalued, indicating a rebound and prompting buying. If the RSI is above 70, it indicates overbought conditions and a potential price correction, while below 30 is oversold, and a price rebound may occur. Between 30 and 70, it's neutral, and traders may hold their positions or wait for more signals before trading. RSI is similar to the redline indicator on a speedometer, which indicates a high speed. Similarly, the RSI indicator that is above 80 denotes an overbought or oversold condition in a security's price. The overbought level indicates a potential correction, while an oversold level suggests a rebound.
RSI is an essential tool to identify potential buy and sell signals. Traders use it to identify bullish or bearish divergence between the indicator and the price action, indicating a potential reversal. When RSI drops below the oversold value, traders look for a potential buying opportunity. Conversely, when RSI rises above the overbought value, traders may look to sell the asset.
How Is RSI calculated?
The formula used to calculate RSI is
RSI = 100 - [100 / (1 + RS)]
where RS is the average of gains and losses over a specified time period. RS is calculated by dividing the average gain by the average loss.
Plotting RSI And Interpreting RSI Charts
To plot RSI charts, calculate the ratio of average gains to average losses over a specified period. Plot the resulting value on a scale of 0-100, with overbought and oversold conditions at 70 and 30, respectively.
To interpret RSI charts, identify overbought and oversold conditions, bullish or bearish divergences, and trendline breakouts. A value above 70 suggests an overbought market, while below 30 indicates an oversold market. Divergences and trendline breakouts can signal a reversal or continuation of the trend.
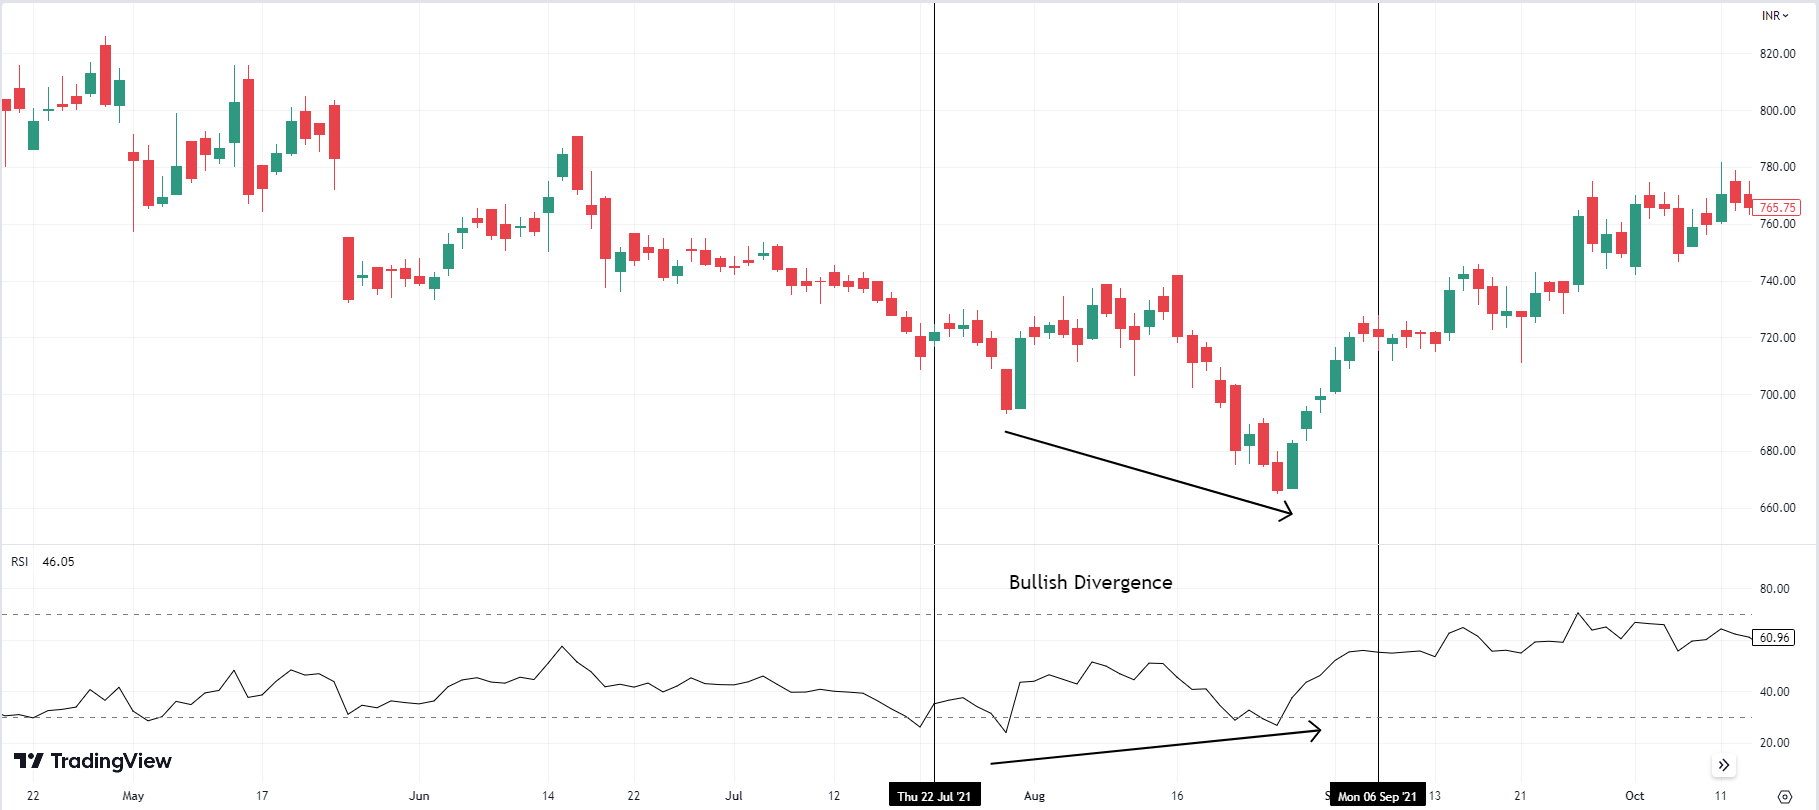
A bullish divergence in RSI occurs when the RSI makes higher lows while the price makes lower lows, suggesting a potential reversal. An overbought RSI combined with a new high in price may indicate a sell-off, while an oversold RSI and a new low in price could suggest a potential bounce.
Stochastic Indicator vs RSI
Stochastic Indicator and RSI are momentum oscillators that identify overbought and oversold conditions. The Stochastic indicator measures the location of the current price relative to the high-low range over a specified period, while the RSI indicator measures the price action's strength.
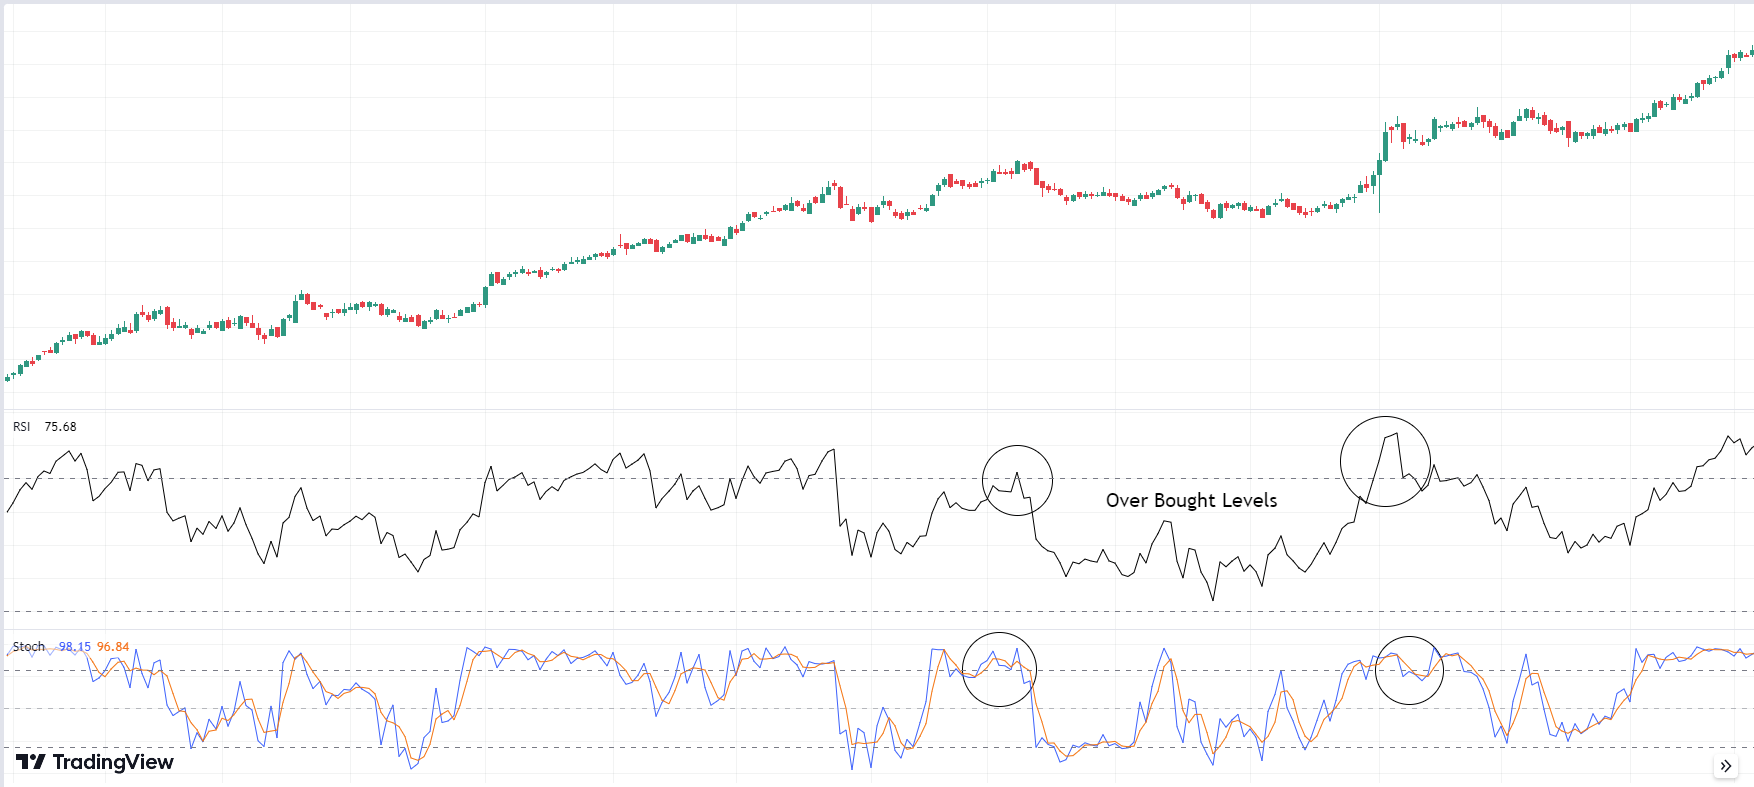
The advantage of the Stochastic indicator is that it is more sensitive to short-term price movements, while RSI is better suited to identify long-term trends. However, Stochastic indicators can be prone to false signals in a choppy market, while RSI can give misleading signals in a strongly trending market.
The Stochastic indicator may be useful in identifying short-term trading opportunities, such as in a range-bound market. At the same time, RSI may be better suited for identifying long-term trends, such as in a trending market. In a volatile market, the Stochastic indicator may give too many false signals, while RSI may be more reliable.
Using RSI For Trend Analysis
RSI can identify overbought and oversold levels within the trend(bearish or bullish). In an uptrend, RSI is expected to stay above 40-50, while in a downtrend, it is expected to stay below 50-60.
To fit RSI levels to trends, traders can modify the overbought and oversold levels based on the market's volatility and the trend's strength. In a strong trend, the levels may be higher or lower than the traditional 70/30 or 80/20 levels.
Buy or sell signals that fit trends can be generated by looking for RSI crossovers with their moving average or identifying bullish or bearish divergences with price action.
Oversold or overbought levels in RSI indicate potential reversal zones. In an uptrend, an RSI reading below the oversold level may indicate a potential buying opportunity. In contrast, an RSI reading above the overbought level in a downtrend may point to a potential selling opportunity.
Limitations Of RSI And Common Mistakes
- Firstly, RSI is a lagging indicator, which relies on historical price data and gives an outcome that has already occurred.
- Relying solely on RSI signals, using default settings without considering the market's volatility, and not combining RSI with other technical indicators and analysis are some of the common mistakes while using RSI.
- To overcome the aforementioned limitations and mistakes, traders can use RSI combined with other technical indicators, modify RSI settings to fit the market's volatility, and confirm RSI signals with other technical analysis.
Using RSI With Other Technical Indicators
When used with other technical indicators such as moving averages, Bollinger Bands, and MACD, RSI can provide a more comprehensive market analysis.
Combining RSI with moving averages or Bollinger Bands helps traders confirm trend direction, identify overbought/oversold conditions, and improve their winning rate by making informed trading decisions.
RSI As A Divergence Indicator
RSI can be used as a divergence indicator to identify potential trend reversals. Bullish divergences occur when RSI makes higher lows while the price makes lower lows, indicating a potential bullish reversal.
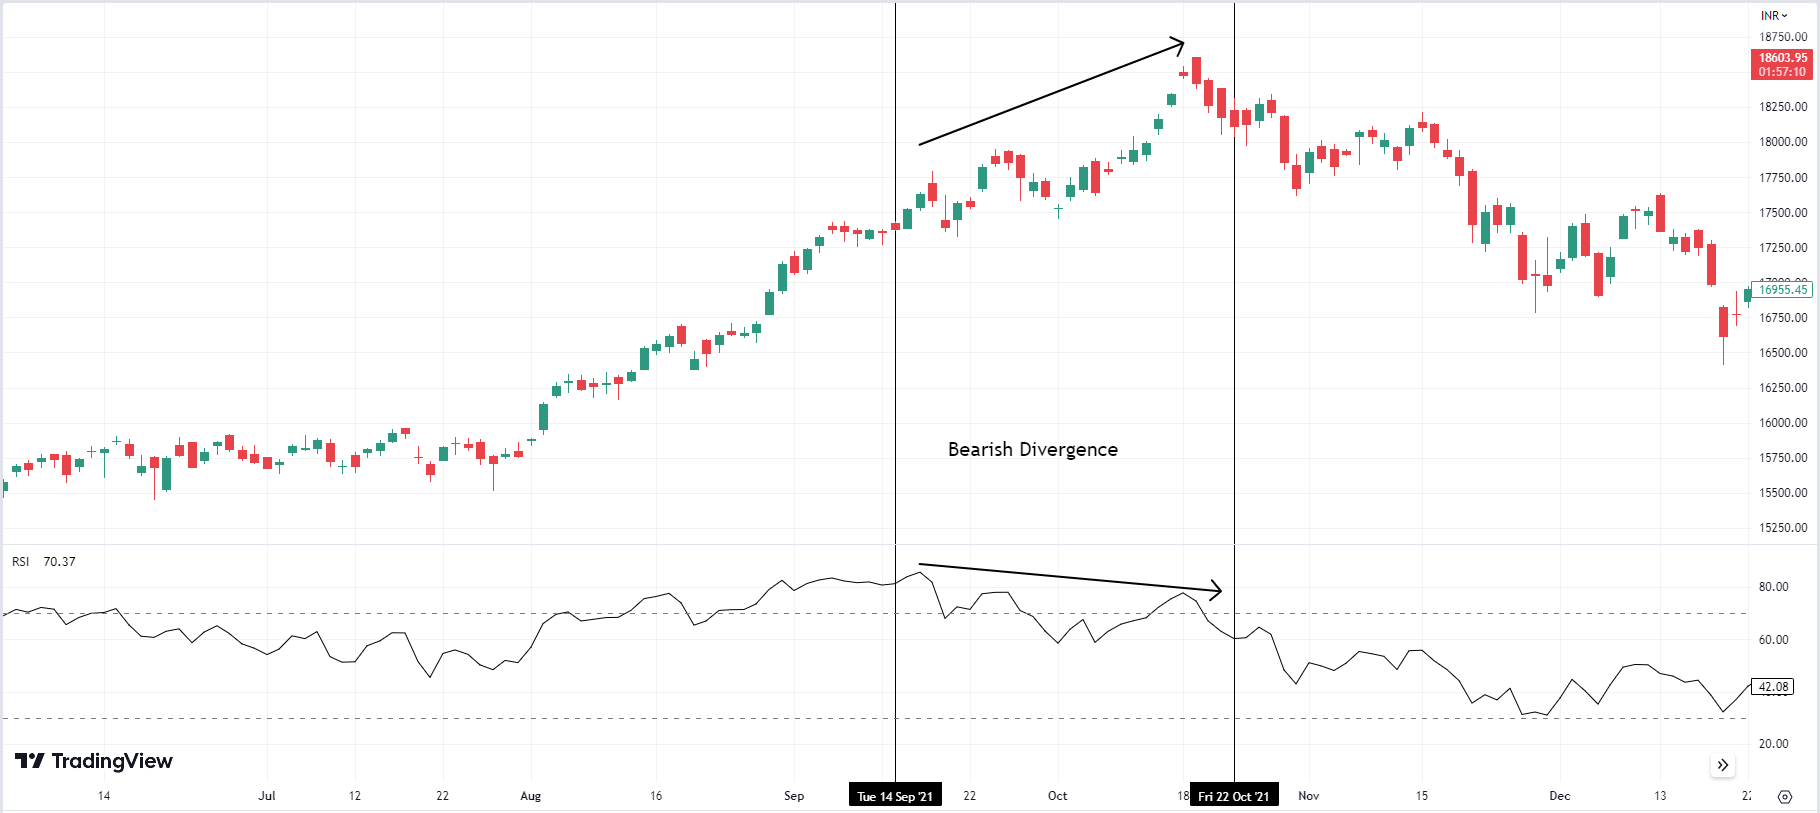
Conversely, bearish divergences occur when RSI makes lower highs while the price makes higher highs, indicating a potential bearish reversal.
A bullish divergence on RSI can occur when a stock is in a downtrend, but RSI is showing higher lows. This may indicate that the selling pressure is weakening and that a reversal will likely occur. Similarly, bearish divergence on RSI can occur when a stock is in an uptrend, but RSI is showing lower highs, indicating that a potential reversal may occur.
Conclusion
The RSI is a tool to identify potential buying or selling opportunities in the market. Traders use it to determine overbought or oversold conditions in a security's price, allowing them to make better decisions on when to buy or sell. By incorporating RSI in their trading strategies, traders can improve their timing of entries and exits, increasing their chances of making profitable trades.
Summary
- The Relative Strength Indicator (RSI) is a widely used tool in technical analysis that helps assess whether a security is overbought or oversold.
- RSI compares the magnitude of recent price changes over a 14-day period and presents it as a value between 0 and 100.
- Traders use RSI to detect overbought and oversold conditions, with readings above 70 indicating potential corrections and readings below 30 suggesting potential rebounds.
- RSI can be calculated using the formula RSI = 100 - [100 / (1 + RS)], where RS is the average of gains and losses over a specified time period.
- RSI charts help identify overbought and oversold conditions, bullish or bearish divergences, and trendline breakouts, providing potential reversal or continuation signals.
- RSI can be used with other technical indicators, such as moving averages and Bollinger Bands, to enhance market analysis and improve trading decisions.
Want to receive the next blog in your mail? Click on the subscribe button and receive the next blog in your mail.


